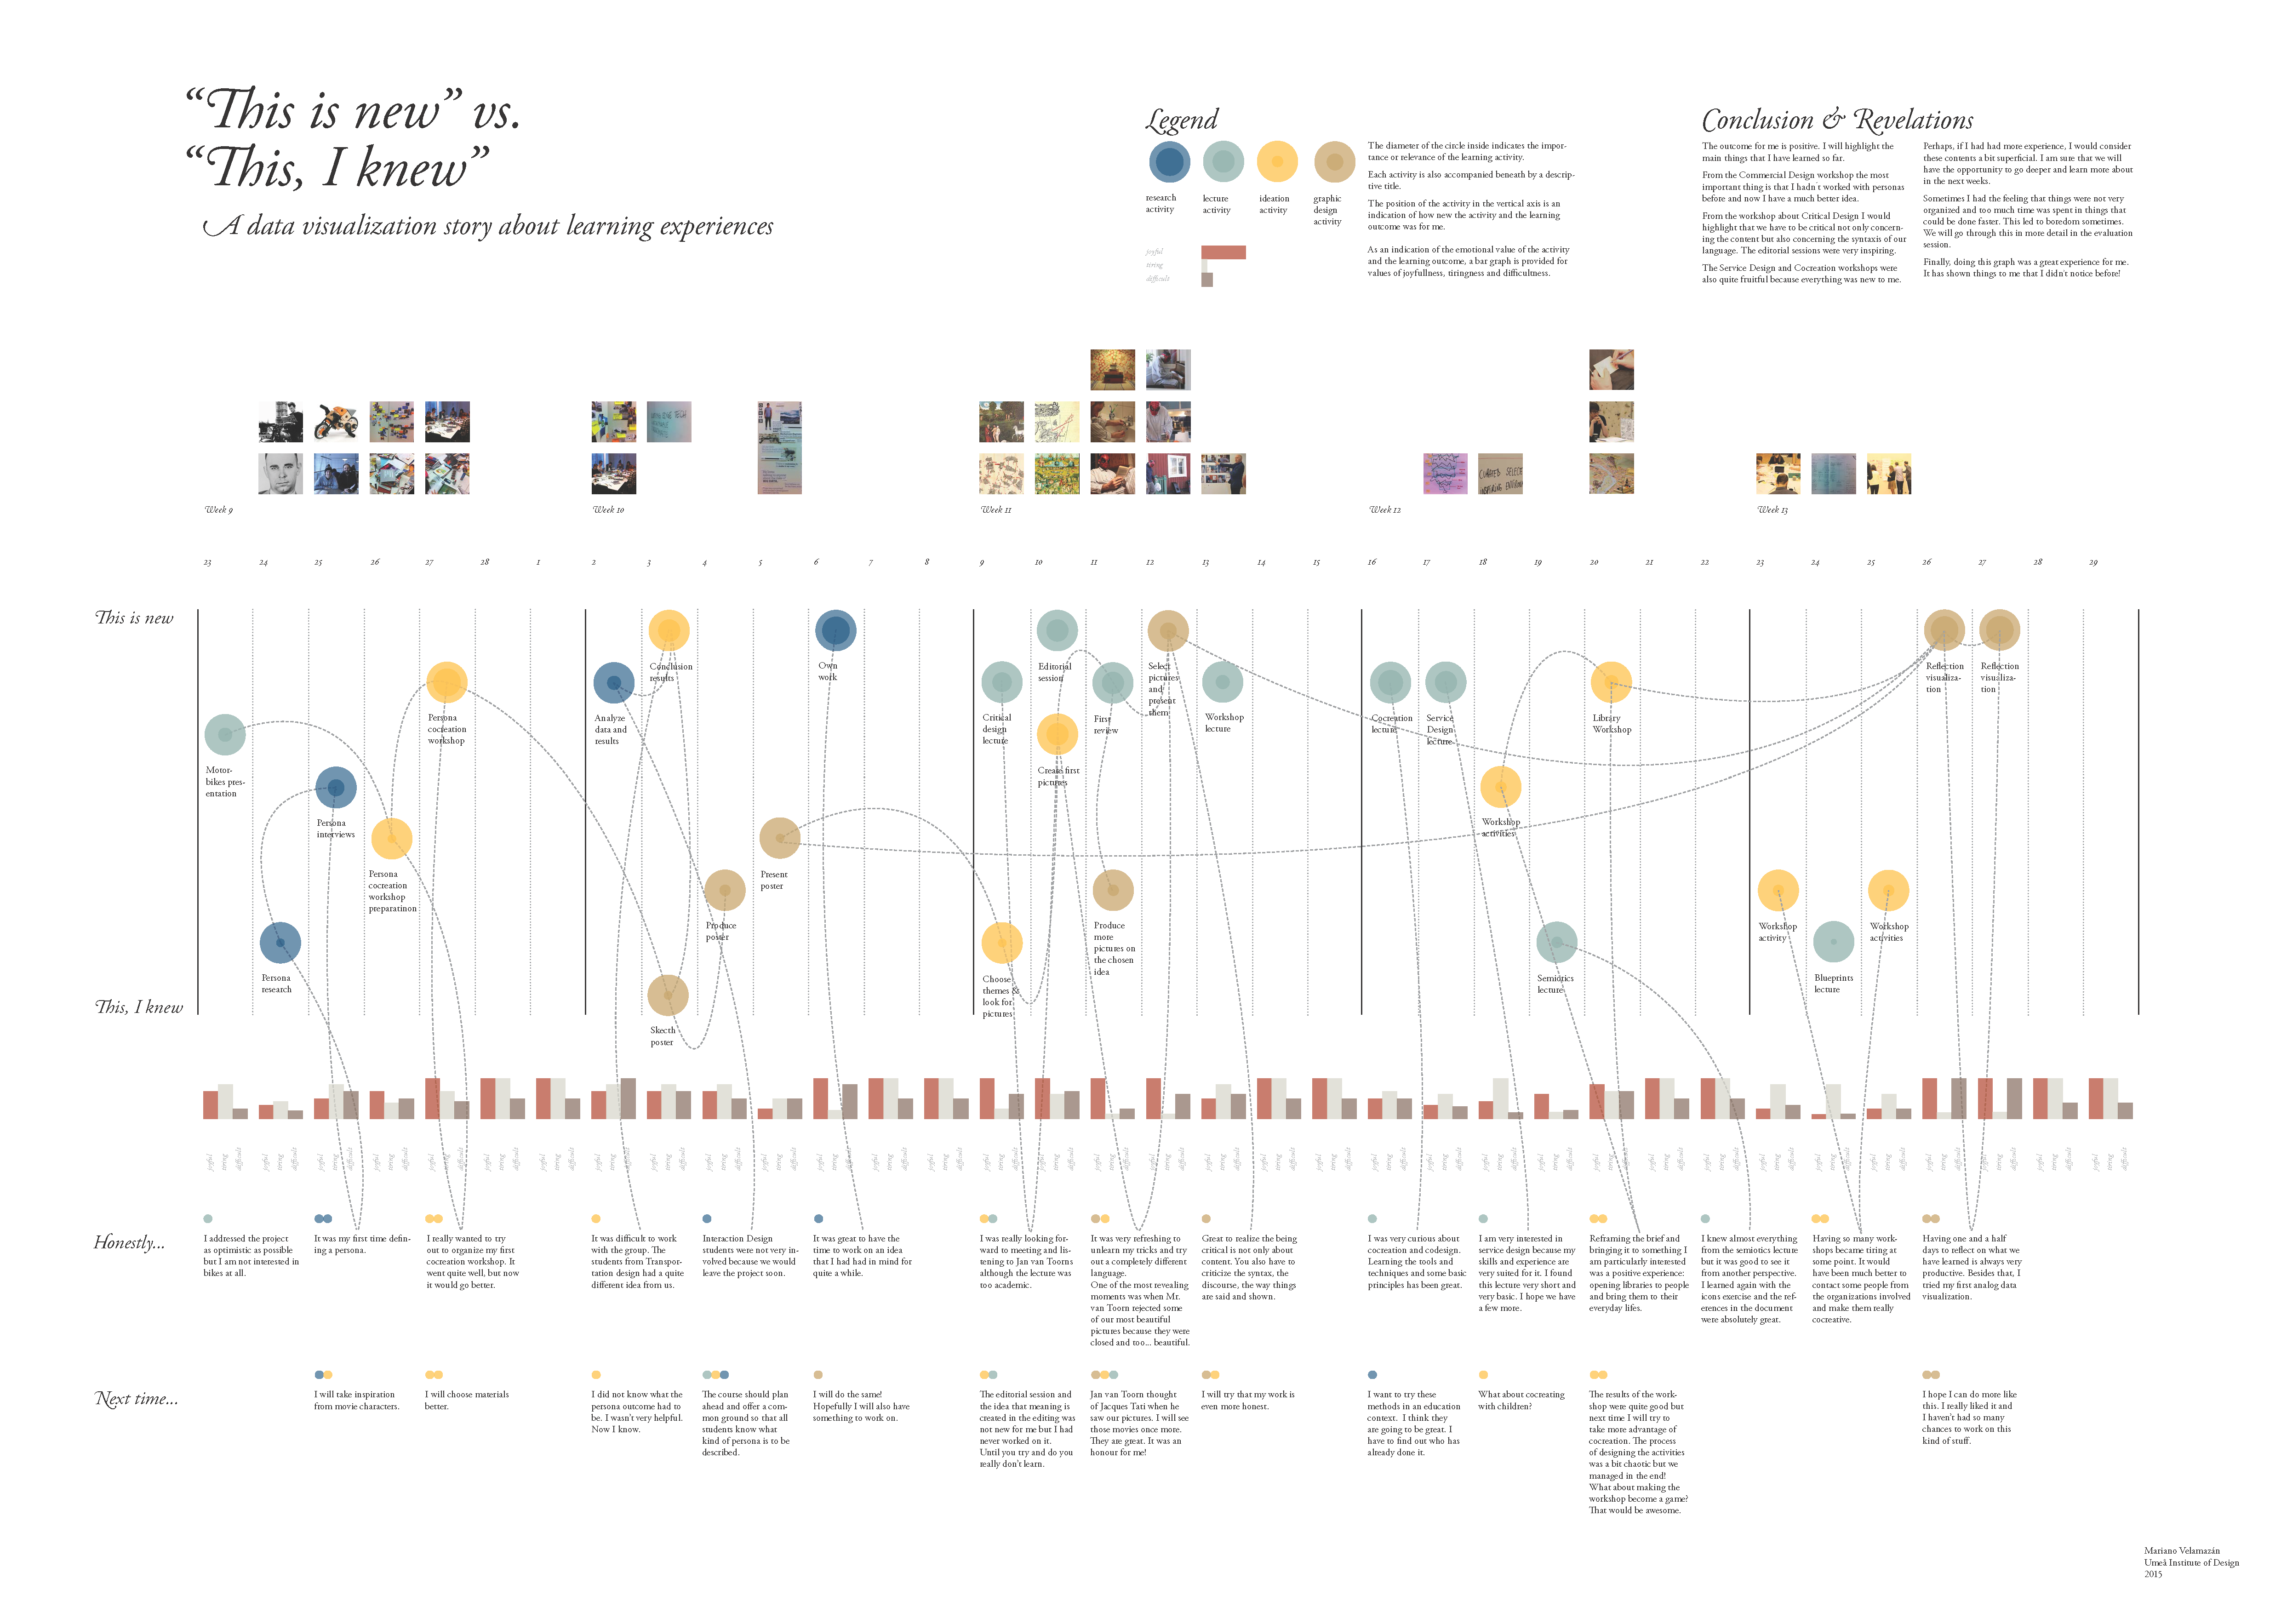
This is new vs. this, I knew (information & web design projects)

This is new vs. This, I knew Data Visualization

Learning is a complex process. How can you explain what you have learned? What happens if you try to visualize it? Can you use quantitative data visualization techniques to explain feelings and emotions? Is it possible to get the whole picture while being able to address the small details? Is a graph able to tell a story?

Detail view about
  • Assignment Brief

The purpose of this course was for the students to:

  • explore alternative ways, through traditional and new media, to
  • visualize and communicate information with focus on Service Design and,
  • provide training in running co-creative design processes together with users and stakeholders.

This course consisted of a series of exercises that were examined continuously throughout the course. During five weeks, we worked on Commercial Communication Design, Critical Communication Design and Workshop on workshops.

By the end of this course, we handed in an 8-page visual reflection paper where we would describe, in ca. 75% visuals and 25% text, our personal reflections on:

  • The value of Communication Design in Interaction Design practice,
  • Challenges and opportunities with Co-Creative Design Processes,
  • Other issues you would like to reflect upon


Detail view about "Honestly" and "Next time"

Reformulated brief

Can we make people understand the complexity of feelings in a visual way? How much can we mix visual languages?

“This is new vs. This, I knew” Data Visualization about Design Process

The presented work is my visual reflection for the last deliverable of the course. It was the first time I had to do a visual reflection over a course and, out of personal interest, I chose to do a data visualization. But I tried to avoid the usual cold and data based graphs and approach the exercise as an emotional story about learning. I wanted to show feelings, self development and narratives related to learning and designing.

The Living City

Ciudad Viva final sketch step 1

Sometimes what remains obscure is not an abstract concept. It is the complexity of interconnected factors what doesn’t let you see beyond the surface. In this project the adventure started when we understood the city as a living organism and tried to use that idea as inspiration for a thesaurus of related documents about urbanism. People would wander like a situationist between texts that reference each other.

Ciudad Viva final sketch step 2

Description

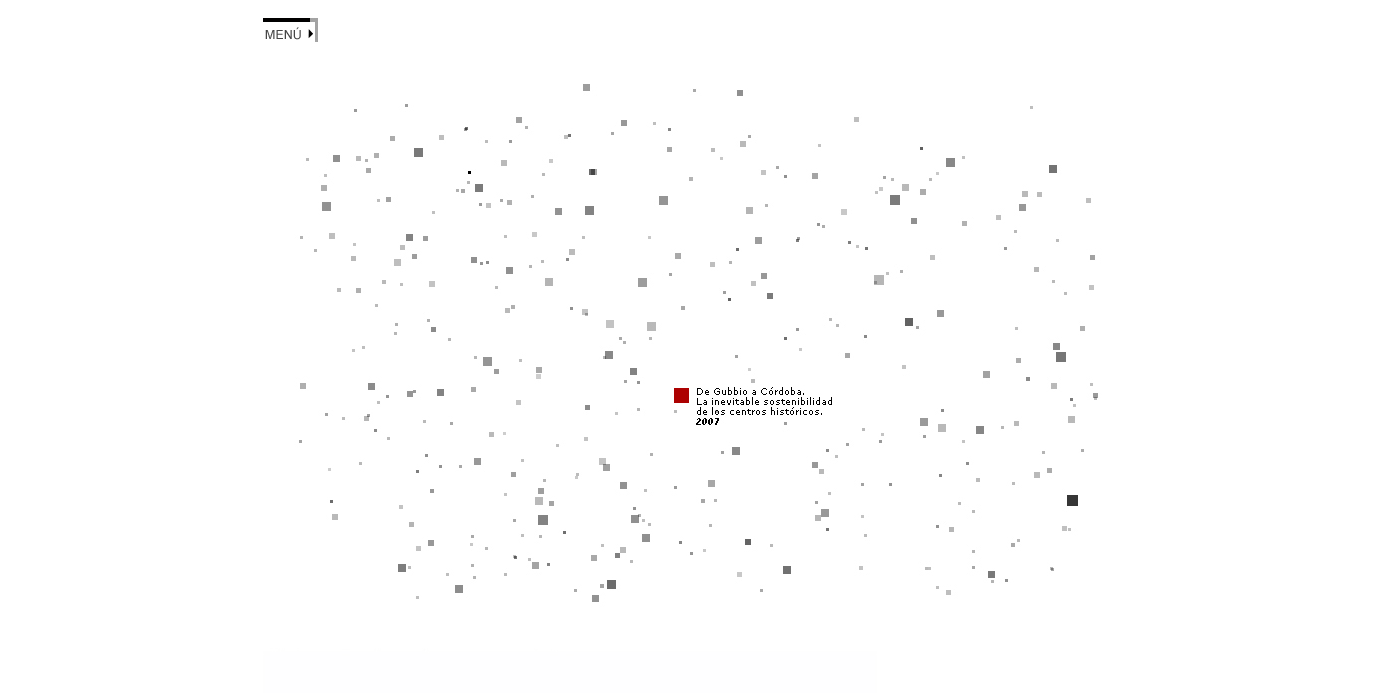
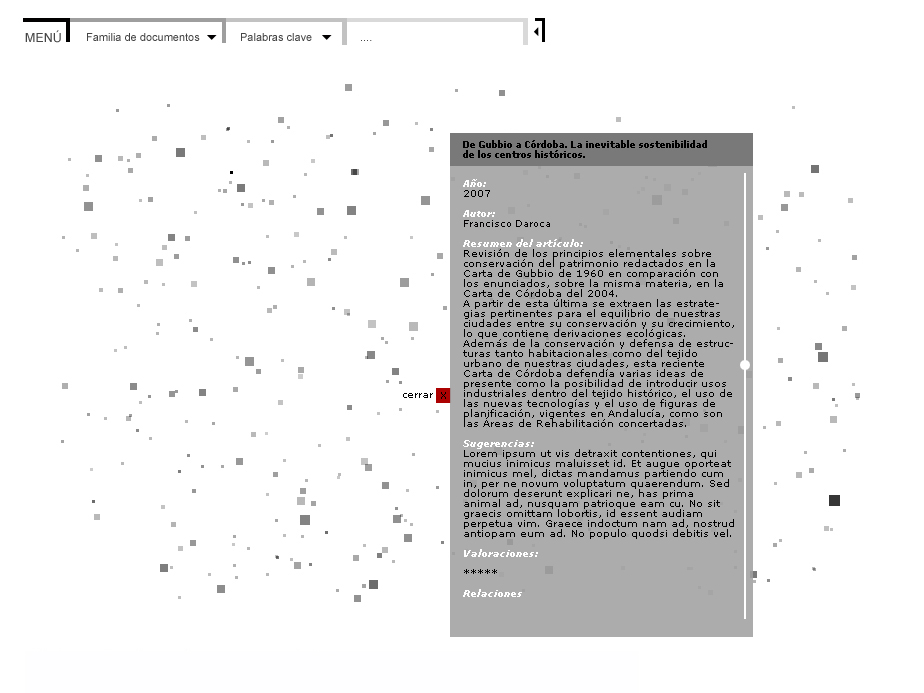
Can we navigate documents the same way we find our way in the city?

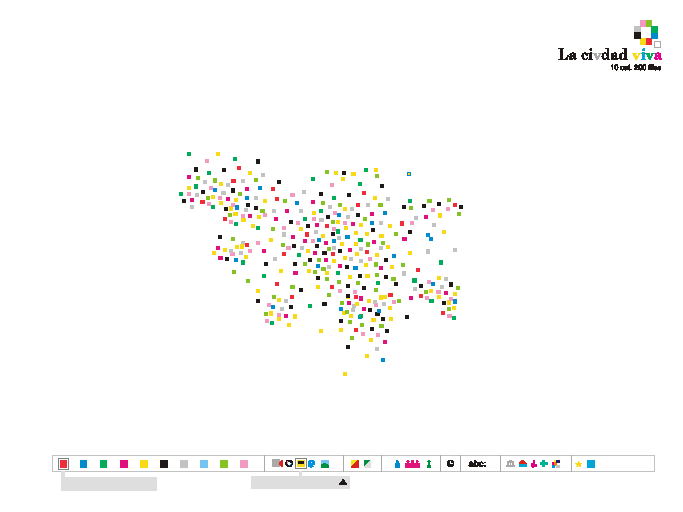
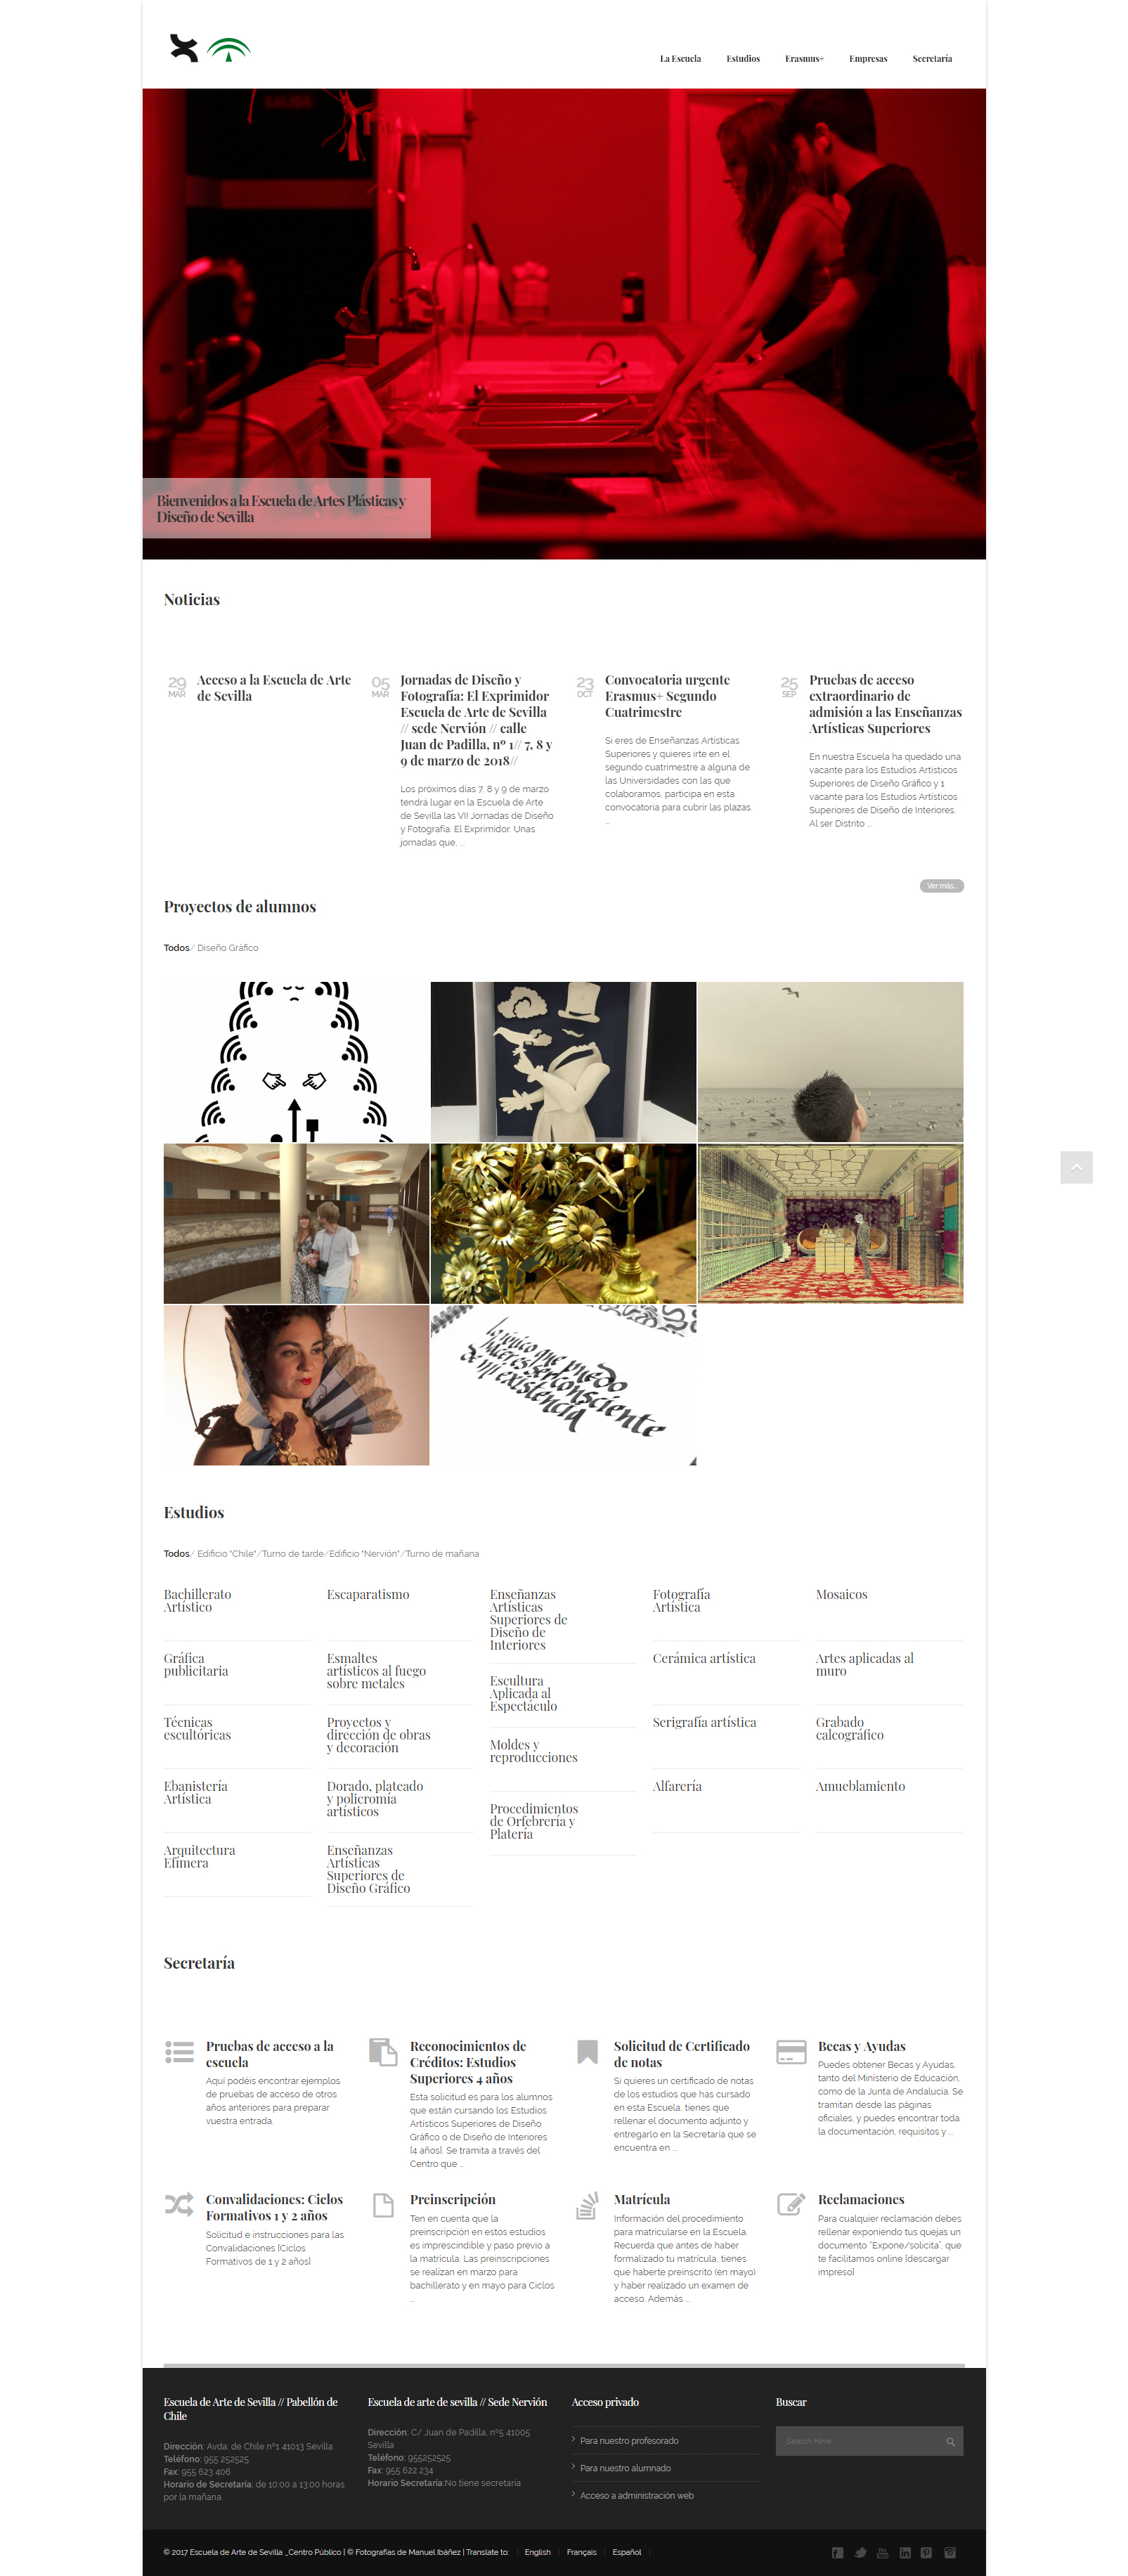
This is an interface for a Thesaurus catalog. It shows information about architecture and society books and the relationship among them under many key concepts (year, author, line of research, etc.). The data visualization was built using flash, XML and SQL. I worked on the graphic design (although the final layout is more the client’s requirements) and the code. You can see the final project (including my client’s design wishes) in la ciudad viva.

Motivation & Process

To propose a change of attitude and an alternative to face the new problems

Cities are in a process of change and transformation.
This should be the starting point to propose a change of attitude and an alternative to face the new problems: new growth model, the value of their urban and social resources, control over energy consumption, energy efficiency , respect for the environment, economic and social cohesion of its territory, among others.

Around these ideas hundreds of documents have been published and the team from La Ciudad Viva contacted us for a simple visualization of all these documents.

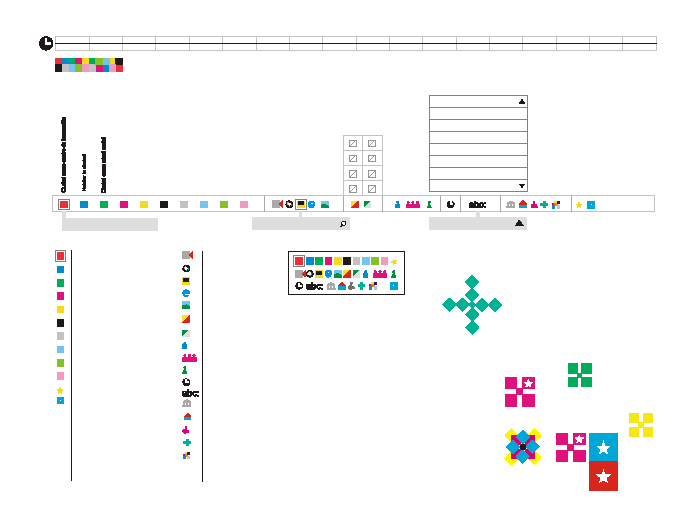
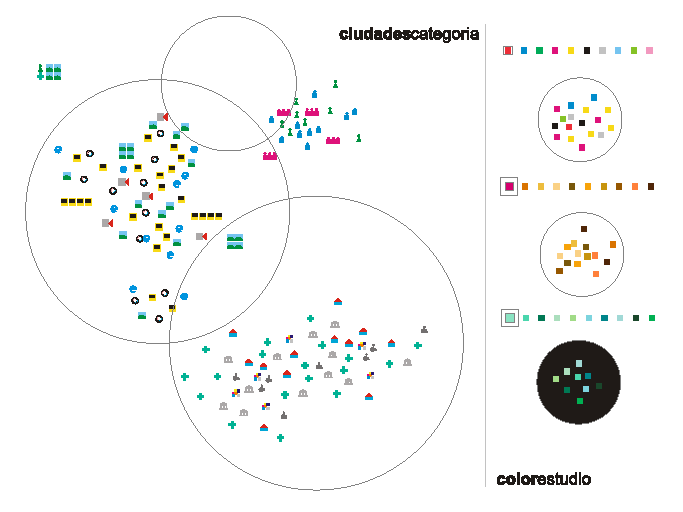
The process was difficult because public institutions had a different view of how things should look like so we went from graphically very ambitious sketches to a more conventional result.

Previous Sketches

Preliminary sketches overview (Dani Aldarias)
Preliminary sketches icons (Dani Aldarias)
Preliminary sketches grouping cities (Dani Aldarias)

Seville School of Design Web Site

A couple of screenshots of my latest web design project for Seville School of Design.

Seville School of Design

About me

Contact

Hi, I am an intreaction designer with a background in Computer Science and Visual Communication. Research through design, ethnography design and participatory design are my main methods of working.

I have a passion for designing learning experiences <nd making visible the invisible.

hi@marianovelamazan.com